Introduction to Candlestick Patterns

Candlestick patterns are essential tools in trading and investing, representing price movements in a visually intuitive manner. These patterns are derived from candlestick charts, which illustrate the open, close, high, and low prices of an asset over a specific timeframe. The primary goal of these charts is to provide traders and investors with a clearer understanding of market sentiment, enabling them to make informed decisions based on visualized data.
A candlestick consists of a rectangular body and two “wicks” or “shadows.” The body represents the price range between the opening and closing prices during the designated period, while the wicks indicate the highest and lowest prices achieved. The ability to decode the information within each candlestick can offer insights into potential market reversals or continuations, which are crucial for effective trading strategies.
The significance of candlestick patterns lies in their ability to summarize complex price movements into simple, digestible formats. By analyzing these patterns, traders can gauge the psychological state of the market participants. For instance, a long bullish candlestick may suggest strong buying pressure, whereas a long bearish candlestick may indicate significant selling pressure. Recognizing these signals can help traders align their strategies with prevailing market conditions.
Moreover, candlestick patterns are often used in conjunction with technical indicators to enhance their predictive power. The integration of candlestick analysis with other analytical tools allows for a more comprehensive assessment of potential price trajectories. Understanding candlestick patterns is fundamental for both novice and experienced traders looking to refine their market approaches and improve their chances of success.
Basic Candlestick Patterns
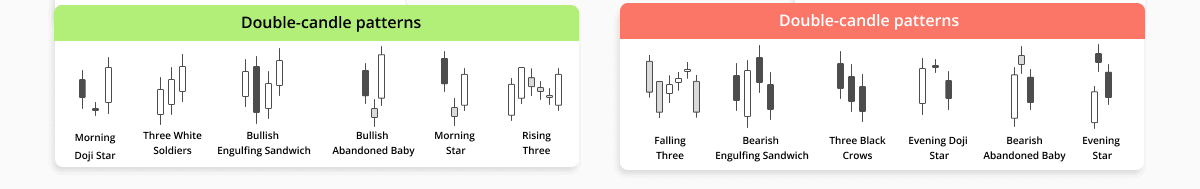
Candlestick patterns are essential tools for traders seeking to understand market sentiment and potential price movement. Among the most fundamental patterns are the Doji, Bullish Engulfing, and Bearish Engulfing. Each of these patterns provides valuable insights into market trends and investor behavior.
The Doji is a unique candlestick pattern characterized by a small body and long wicks, indicating that the opening and closing prices are nearly equal. This pattern often signifies indecision in the market, suggesting that neither buyers nor sellers have the upper hand. When observed after a bullish trend, a Doji may hint at a potential reversal or pause in momentum, prompting traders to exercise caution.
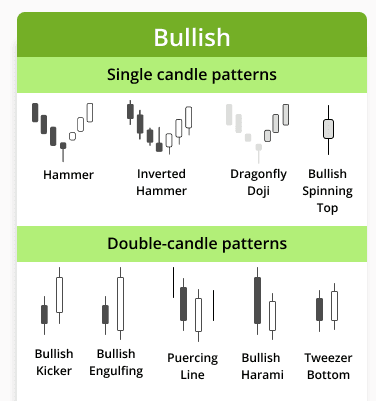
Moving on to the Bullish Engulfing pattern, this pattern occurs when a small bearish candlestick is followed by a larger bullish candlestick that completely engulfs the previous day’s body. This pattern suggests a shift in control from sellers to buyers, signaling a potential bullish reversal. Traders commonly interpret this pattern as a strong indication that the market is likely to continue rising, thus providing opportunities for entering long positions.
Conversely, the Bearish Engulfing pattern represents a potential trend reversal in the opposite direction. It appears when a small bullish candlestick is followed by a larger bearish candlestick that engulfs the previous day’s body. This pattern indicates that sellers have regained control and may point to a downturn in prices. Traders often look for confirmation before acting on this pattern, as it can signal an impending bearish trend.
Recognizing these basic candlestick patterns is crucial for developing effective trading strategies. By understanding what these patterns signify regarding market trends, traders can make more informed decisions and manage their portfolios more effectively.
Reversal Candlestick Patterns
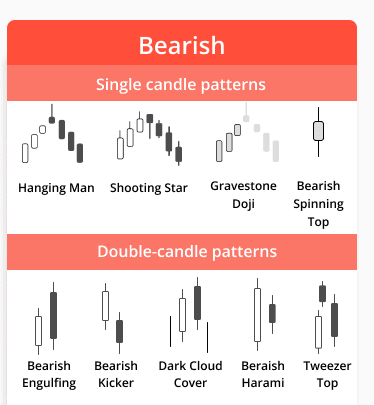
Reversal candlestick patterns are vital tools for traders, as they indicate potential changes in the direction of price movement. These patterns can signal the end of a prevailing trend, providing traders with opportunities to capitalize on impending market reversals. Among the various reversal patterns, the Hammer, Inverted Hammer, Shooting Star, and Evening Star are particularly notable.
The Hammer is recognized by its distinctive shape, appearing as a candlestick with a small body and a long lower shadow. This pattern typically forms after a downtrend, suggesting that buyers are beginning to step in, which may lead to an upward price movement. Similarly, the Inverted Hammer, displayed in an uptrend, highlights the potential for a price reversal. Its structure is akin to that of the Hammer but with a long upper shadow, indicating seller resistance. Both patterns reflect the psychology of market participants, showcasing the struggle between buyers and sellers.
The Shooting Star is another critical reversal candlestick, marked by a small body and a long upper shadow, usually occurring following an uptrend. This pattern signals bearish sentiment, as buyers push prices up only for sellers to overpower them, suggesting a possible trend change. Conversely, the Evening Star pattern comprises three candlesticks: a strong bullish candle, a small-bodied candle, and a bearish candle that confirms the reversal. This sequence demonstrates a shift in momentum and is often interpreted as a definitive turning point in market trends.
Traders employ these reversal candlestick patterns to identify potential shifts in market direction, enhancing their decision-making processes. Understanding the underlying psychology and context of these patterns allows market participants to anticipate volatility and strategically position themselves in the market. By incorporating these patterns into their analysis, traders can improve their odds of successfully predicting market reversals.
How to Analyze Candlestick Patterns
Analyzing candlestick patterns requires a comprehensive understanding of various analytical techniques that can significantly enhance trading decisions. One of the primary methodologies is volume analysis, which provides insights into the strength and validity of a candlestick pattern. When a pattern forms on a candlestick chart alongside high trading volume, it is often regarded as more reliable than patterns that occur during periods of low volume. Significant volume indicates strong market interest in the asset being traded, reinforcing the potential movement suggested by the candlestick formation.
Timeframes also play a crucial role in the analysis of candlestick patterns. Different timeframes can convey varying levels of market sentiment and trends. For instance, a pattern that appears on a daily chart may suggest a different market outlook than the same pattern observed on an hourly chart. Shorter timeframes may indicate volatility and quick price movements, while longer timeframes tend to represent broader trends. Therefore, traders are encouraged to analyze candlestick patterns across multiple timeframes to gain a more nuanced perspective on market conditions.
Integrating candlestick patterns with other technical indicators can further refine trading strategies. For example, moving averages can provide insight into the prevailing trend, while oscillators can help identify overbought or oversold conditions. When a candlestick pattern aligns with signals from other indicators, traders can gain greater confidence in their predictions and potential entry or exit points. By adopting this multi-faceted approach, one can harness the full potential of candlestick patterns, boosting their effectiveness in a trading strategy.
Common Mistakes in Reading Candlestick Patterns
Candlestick patterns are pivotal in technical analysis, yet many traders fall victim to common misinterpretations when utilizing them. One prevalent pitfall is confirmation bias, which occurs when traders selectively seek information that confirms their preconceived notions and disregard contrary indicators. This cognitive bias can lead to a skewed perception of a candlestick pattern’s effectiveness. For instance, a trader might see a bullish engulfing pattern and ignore underlying bearish signals, thus making an uninformed decision. Recognizing this tendency and questioning one’s assumptions can mitigate the impacts of confirmation bias.
Overtrading is another mistake associated with candlestick patterns. Traders often commit the error of entering and exiting trades too frequently based solely on perceived patterns. This behavior can be exacerbated when traders mistakenly interpret minor fluctuations as significant signals. While candlestick patterns provide valuable insights, they should not be the sole basis for trading decisions. Developing a well-rounded trading strategy that incorporates additional technical indicators and fundamental analysis can offer a more balanced approach, limiting the risk of impulsive trading actions.
Additionally, neglecting other key market factors fosters misinterpretation of candlestick patterns. It is crucial to consider market trends, economic news, and broader trading volumes when analyzing candlestick formations. For example, a seemingly bullish pattern within a downtrend could indicate a temporary spike rather than a true reversal. To enhance trading effectiveness, traders must adopt a comprehensive view that includes multiple factors affecting price movements. Adhering to a disciplined strategy that combines candlestick analysis with broader market context empowers traders to make informed decisions and potentially avoid the pitfalls associated with common mistakes.
Conclusion: Mastering Candlestick Patterns
In this blog post, we have explored the foundational concepts of candlestick patterns, which are essential tools for traders seeking to enhance their market analysis skills. Candlestick patterns provide a visual representation of price movement and can reveal critical insights into market sentiment and potential future price action. The ability to interpret these patterns allows traders to make informed decisions, manage risk, and capitalize on trading opportunities.
To reiterate, mastering candlestick patterns involves understanding their formations and the implications they carry within the context of broader market trends. Each pattern, whether it is a single candlestick or a combination of several, tells a story about buyer and seller dynamics. Recognizing these patterns can significantly boost your trading acumen, leading to more successful trades and strategies.
It is crucial for traders to practice analyzing various candlestick patterns across different timeframes and market conditions. As with any skill set, regular practice reinforces knowledge and helps traders develop an intuitive grasp of market behavior. The ongoing process of learning and adapting is essential in the constantly evolving world of trading. We encourage readers to seek out more resources such as advanced trading courses, books on technical analysis, and online discussion forums dedicated to candlestick strategies.
By engaging with these materials and incorporating candid practice into their trading routines, traders can elevate their understanding of candlestick patterns to new heights. Mastering these patterns not only fosters confidence but also enhances overall trading performance. Remember that the journey of learning is continuous, and each step taken brings you closer to becoming a proficient trader.